The below figure shows the imc Learning Analytics components briefly.
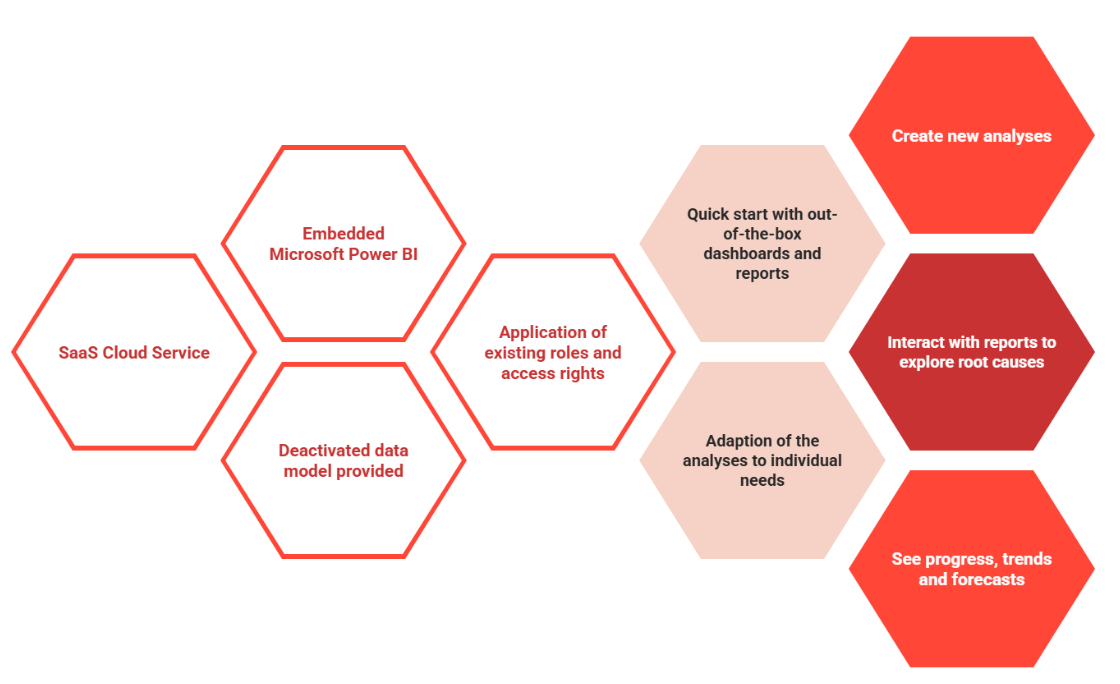
The details are described in the following.
SaaS Cloud Service
imc Learning Analytics is a new cloud service provided by Scheer imc. Microsoft Power BI Embedded is provided by Microsoft as a cloud service only. Using imc Learning Analytics as SaaS by Scheer imc allows customers to take full advantage of cloud solutions, including automated scaling of service performance during workload peaks, lower costs through shared-service usage, and outsourced hosting responsibility handled by Scheer imc experts.
The hosting service for imc Learning Suite, imc Learning Analytics, and Microsoft Power BI Embedded is fully provided by Scheer imc. Scheer imc remains the single contact for the hosting scenario.
Embedded Microsoft Power BI
imc Learning Analytics has been fully integrated into imc Learning Suite. This enables direct use of the Power BI function set from within imc Learning Suite. Scheer imc sets up a Microsoft Power BI workspace and provides a Microsoft Power BI Pro account to access and manage the workspace. For information about Power BI itself, refer to https://powerbi.microsoft.com.
Microsoft Power BI is hosted in Microsoft Azure, providing strong connectivity for global-scale usage scenarios. For more details on the integration of Microsoft Power BI, refer to Learning Analytics Report PowerBI.
One Microsoft Power BI Pro account would be associated with only one individual email-address. No group email addresses are permitted.
Dedicated Data Model
The imc Learning Suite database is optimised for best performance in daily operational learning management tasks. With imc Learning Analytics, customers receive a data model optimised and enhanced by Scheer imc for Learning Analytics purposes and hosted on Microsoft Power BI.
This provides better Learning Analytics performance and easier access to and understanding of the included data model for report adaptation or new report creation.
In addition, especially in the context of the out-of-the-box reports (Learning Analytics Dashboards and Reports) included in the Scheer imc Learning Analytics service, Scheer imc provides measures and calculated tables. This addresses best-practice-based Key Performance Indicators composed by Scheer imc development to support data correlation scenarios.
Application of Existing Roles and Access Rights
When using imc Learning Analytics, access-right management can be fully based on the existing setup in imc Learning Suite. Access rights to reports can be managed in the same way as the imc Learning Suite standard reports already used within imc Learning Suite. A report can be defined to consider the reporter’s access rights to content, such as learning paths or courses, or to users within the already existing and configured context of imc Learning Suite.
Quick Start with Out-of-the Box Dashboards and Reports
imc Learning Analytics is prefilled with dashboards and reports covering best-practice scenarios from the customer base. This provides a head start by enabling assignment of the dashboards and reports to the intended reporting audience. The detailed description of the out-of-the-box dashboards and reports can be found in Learning Analytics Dashboards and Reports.
Adaption of Analyses to Individual Needs
Following the flexible approach of imc Learning Suite in general, imc Learning Suite Analytics provides a high level of flexibility for configuration according to concrete needs. The out-of-the-box report can be duplicated and adjusted to specific requirements before being assigned again to the relevant user groups. This includes changing filters or thresholds defined by Scheer imc, as well as deleting or adding further Power BI KPI metrics and visuals.
Create New Analysis
imc Learning Analytics supports self-service for additional individual analysis use cases by providing direct access to the analytics data model via Microsoft Power BI Embedded. A new analysis can begin with an empty canvas, where Microsoft Power BI visuals are added and evaluation criteria are assigned by dragging and dropping data values onto the visuals.
Interact with Reports to Explore Root Causes
imc Learning Analytics provides drill-through and drill-down capabilities to support root cause analysis as needed. The out-of-the-box dashboards and reports provide insights from management level through mid-management level, such as business units or groups, down to supervisor level for analysis of direct-reporting learners. Drill-down supports top-level granular details for a specific learner or a specific course or learning path in imc Learning Suite. Based on this starting point for root cause analysis, users with access rights to the corresponding dataset can exploratively add further metrics to the provided details to identify correlations through flexible exploration.
See Progress Trends and Forecasts
Learning Analytics focuses on trends and forecasts. This provides transparency on whether actions taken for improvement based on Learning Analytics insights have improved the trend. These capabilities are enabled by corresponding visuals in Power BI Embedded and data model optimisations provided by Scheer imc for out-of-the-box reports. Trends and forecasts can also be created through self-service when adapting out-of-the-box reports or creating new reports.