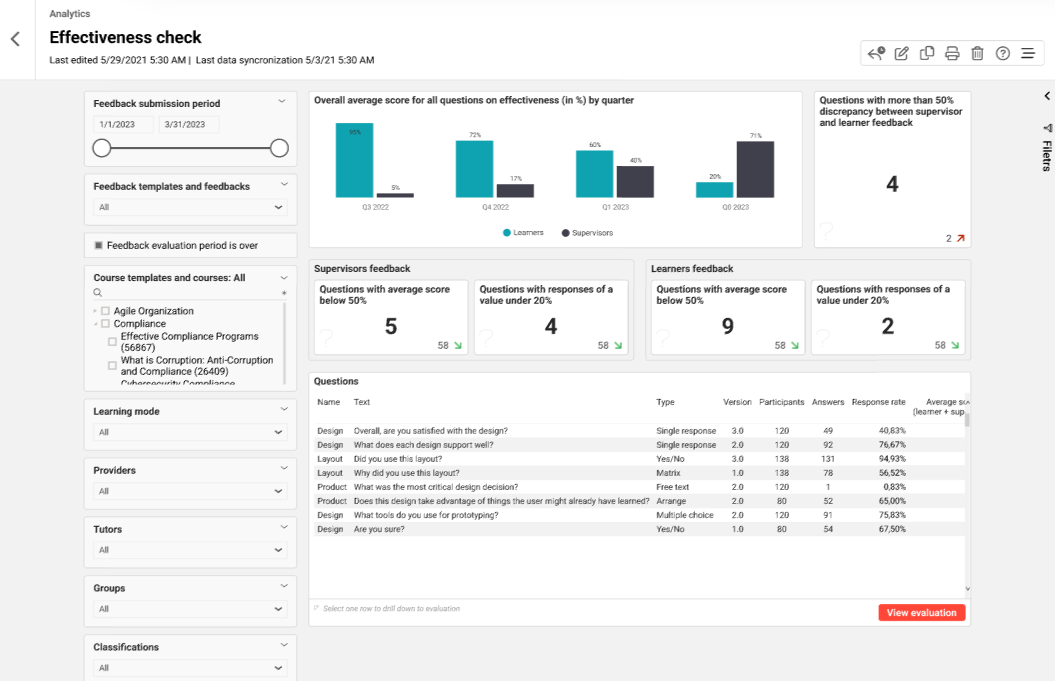
This report provides the report executor with a detailed evaluation of the effectiveness check feedback form responses so that he can evaluate the effectiveness of the trainings being conducted.
Key Performance Indicators
The effectiveness check report analyses the following KPIs in the order mentioned.
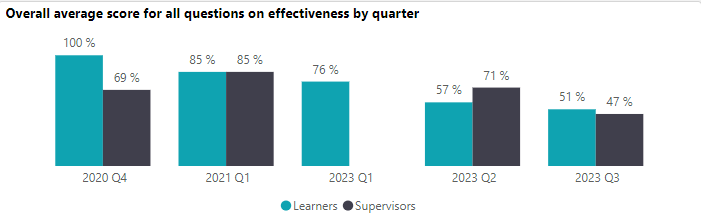
This KPI shows the average score for all questions on effectiveness (in percentage) by quarter. Average Score is calculated as follows:
Yes/No - (no. of users who have responded yes / total no. of replies) * 100.
Single response - (average value of the responses/highest value) * 100
Multiple choice - (average value of the responses/highest value) * 100
Free text: no. of participants who have responded positive / total no. of replies) * 100.
Matrix: sum of average values of each row / no of rows
For Arrange feedback form question type, average score is n/a.
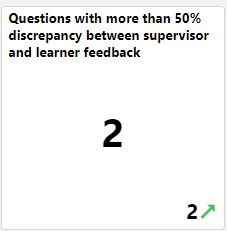
This KPI displays a count of questions with more than 50% discrepancy between supervisor and learner feedback.
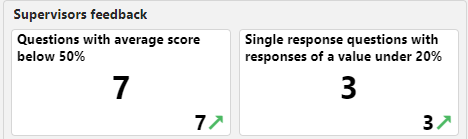
This KPI displays the number of questions with an average score below 50% reflecting the courses which have not been well-received by the participants and need further improvement.
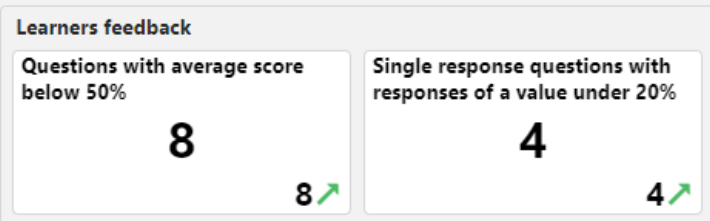
Also the KPI displays the number of single response questions which have received even a single response lower or equal than 20% of the maximum value and thus helps to identify the outliers.
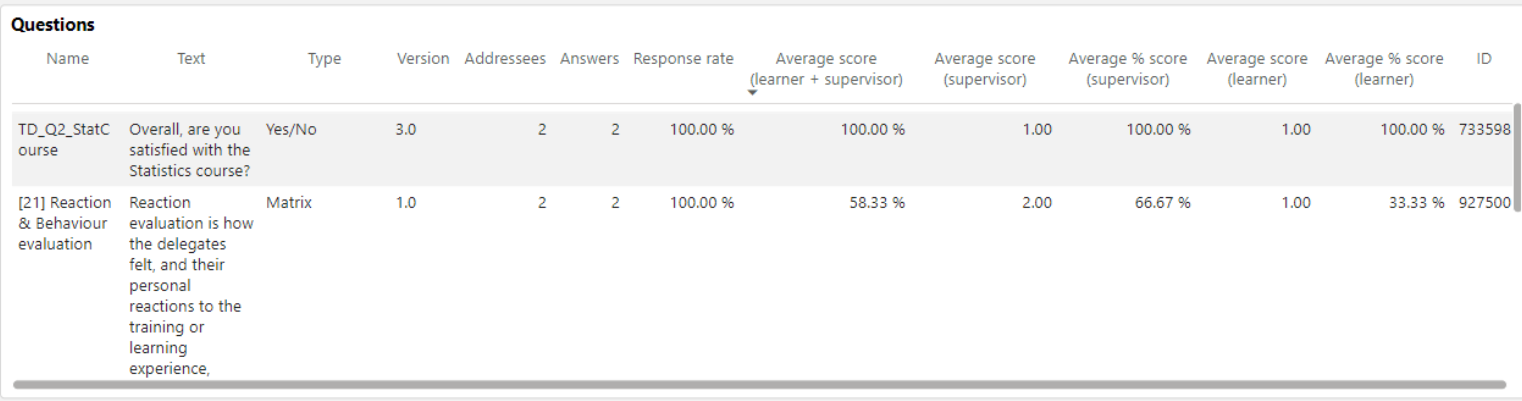
This overview displays the question´s name, text, type, published version, no. of addressees (participants (enrolled, in progress, passed, failed, cancelled if response has been submitted) and their supervisor), no. of replies, response rate, avg. response value in % (learner and supervisor combined), avg. response value (supervisor), avg. response value in % (supervisor), avg. response value (learner)
avg. response value in % (learner) and question ID.
Please note AI functions has been depreciated by Microsoft as of Sep, 2005. The “Average score” for free-text questions would be 0% for the time-being.
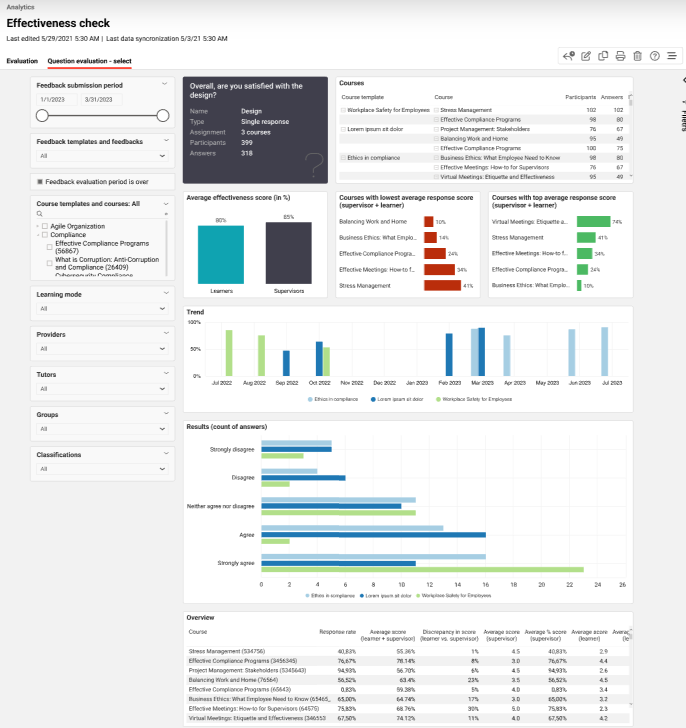
Drill-down Page
The drill-down page analyses the following KPIs in the order mentioned.
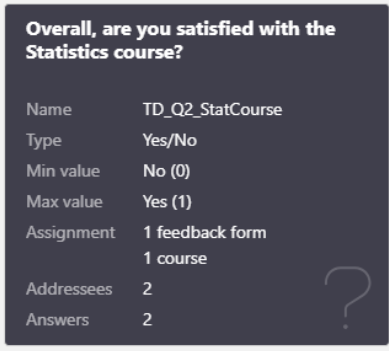
This card is shown if the specific question is selected. It displays question text, name, type, minimum value, maximum value, no. of feedback forms, courses, addresses to which have this question has been assigned, no. of replies.
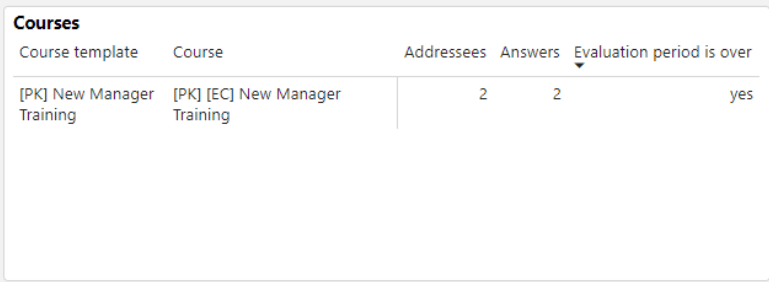
This overview displays course templates and courses to which the selected feedback question has been assigned, addresses, no. of replies and if feedback evaluation period is over.
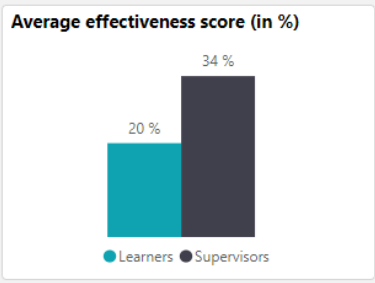
This KPI displays the average effectiveness score (in %) given by the learners and supervisors for the selected feedback question.
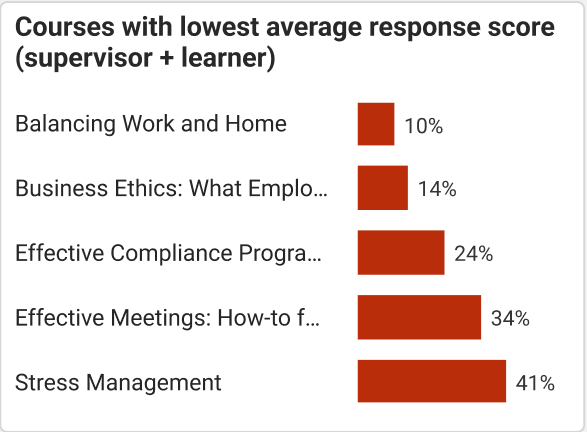
This KPI displays the courses with lowest average score (in %) given by the learners and supervisors for the selected feedback question.
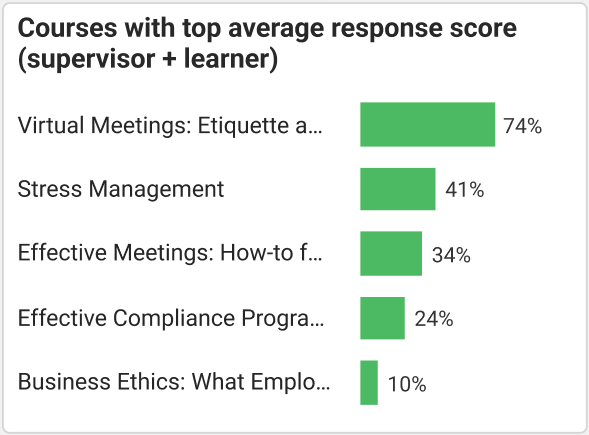
This KPI displays the courses with top average score (in %) given by the learners and supervisors for the selected feedback question.
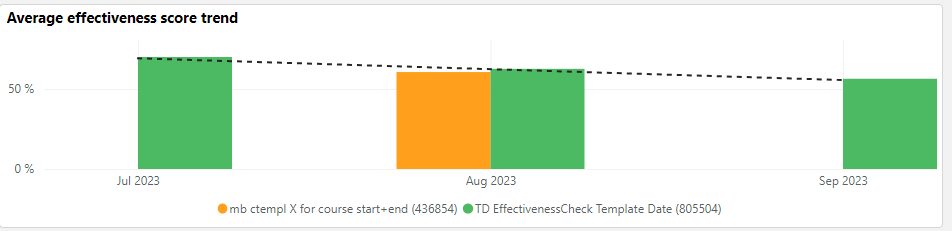
This KPI displays the trend of the combined average score (in %) by the learner and the supervisor compared by the course templates (including versions) for the selected question.
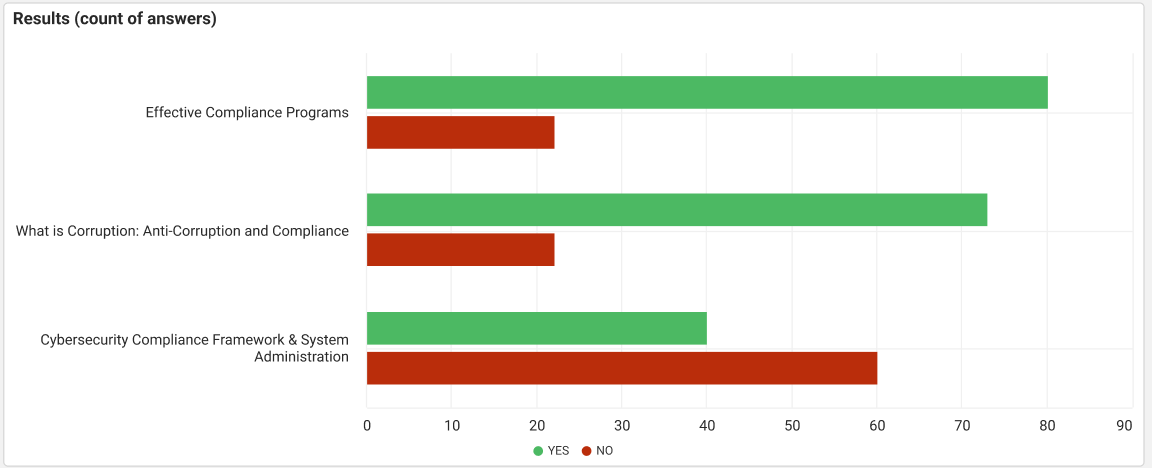
This KPI displays how many participants have chosen yes and how many have chosen no for the selected Yes/No feedback question and compare it across the courses.
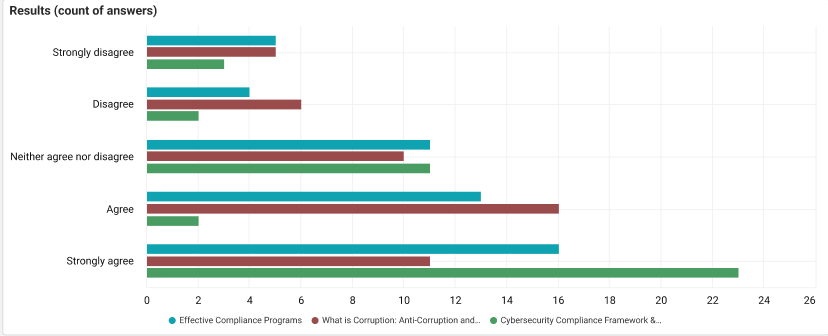
This KPI displays how many participants have chosen the specific option for single response/multiple choice feedback question and compare it across the courses.
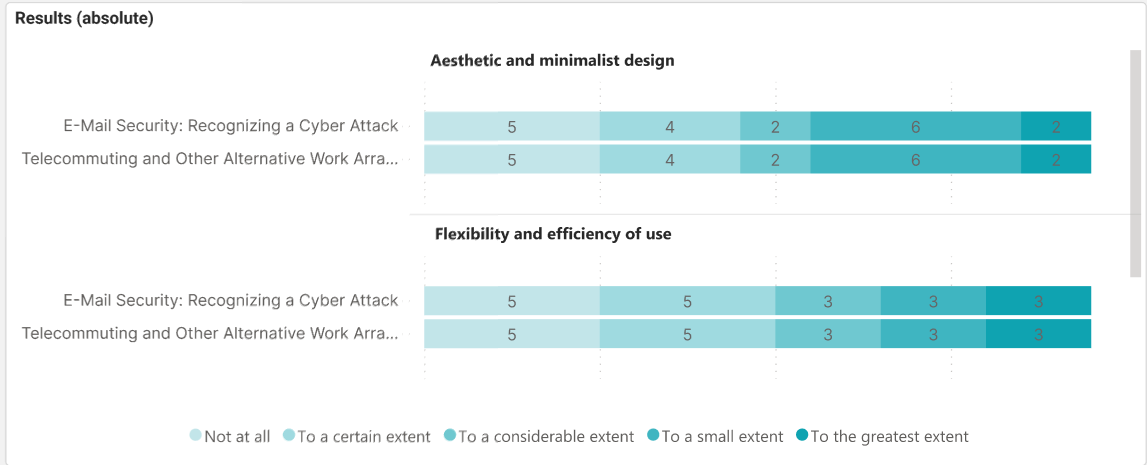
This KPI displays the number of participants who have chosen the respective option in each row of the selected matrix feedback question and compare it across the courses.
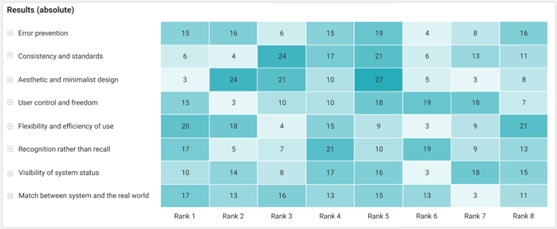
This KPI displays the number of participants who have ranked the specific item as first, second and so on for the selected arrange feedback question and compare it across the courses.
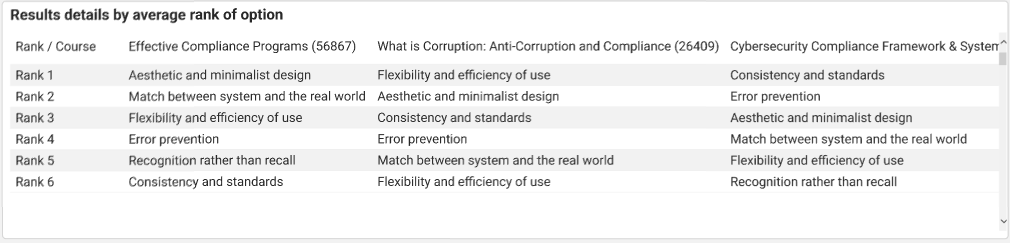
This KPI displays the highest average rank option for the selected arrange question and compare it across the courses.

This KPI displays responses for the selected free-text feedback question and marks it as positive, negative, or neutral and compares it across the courses.
Please note AI functions has been depreciated by Microsoft as of Sep, 2005. The visuals dependent on sentiment analysis would not show data for the time being.
Metrics
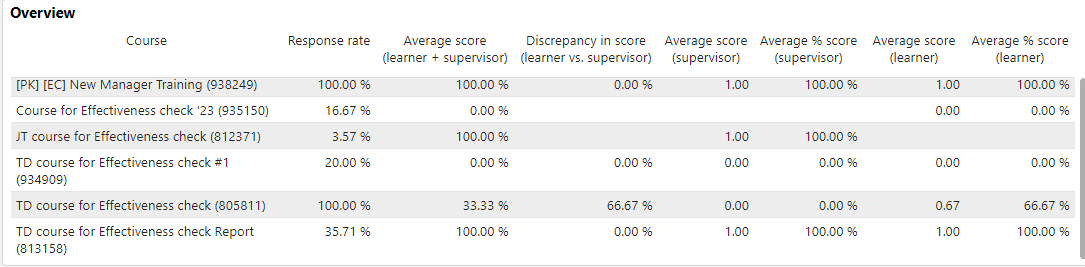
This overview displays the course name, response rate, average respondents score, discrepancy in score (learner vs supervisor), average score (supervisor), average % score (supervisor), average score (learner), average % score (learner), course card.
Metrics
The effectiveness check report allows filtering the report results by the following metrics in the listed order.
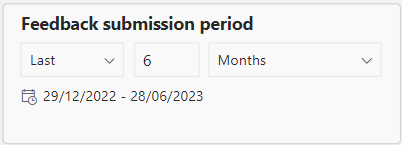
This metric filters the report by the desired feedback submission period when the feedback form was submitted. The default time period is 6 months.
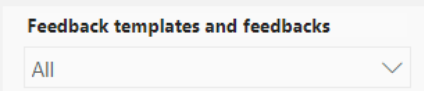
This metric lists all feedback form templates and feedback forms assigned to the courses the reporter has access rights. The selection of a feedback form template also selects all listed feedback forms of that template.
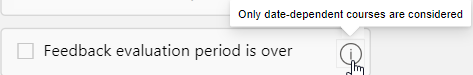
When the “Feedback evaluation period is over” is selected, only the questions from the feedback forms assigned to date-dependent courses for which the feedback evaluation period is over are considered.
N/A is shown in case no such feedback question is available.
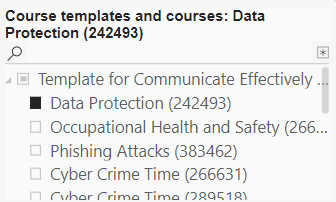
This metric list all courses the reporter has access rights and their course templates. The choice of a course template also selects all listed courses of that template.
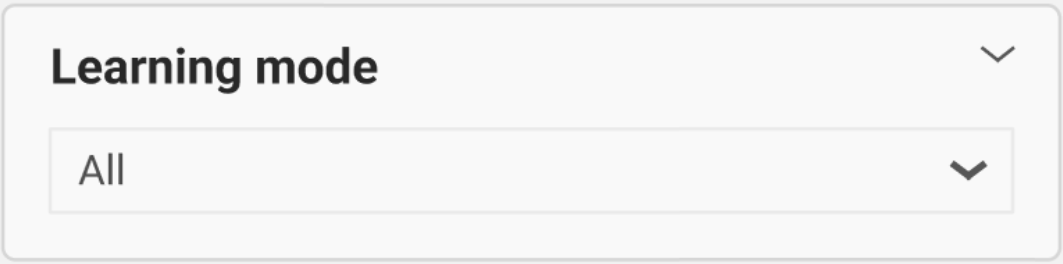
This metric list all learning modes assigned to the courses the reporter has access rights.
This metric lists all providers assigned to the courses the reporter has access rights.
This metric lists all tutors who have been assigned the tutor role in the course template and courses the reporter has access rights.
This metric filters the report by the desired classification assigned to the feedback form question belonging to the effectiveness check feedback form of the courses the user has access to.