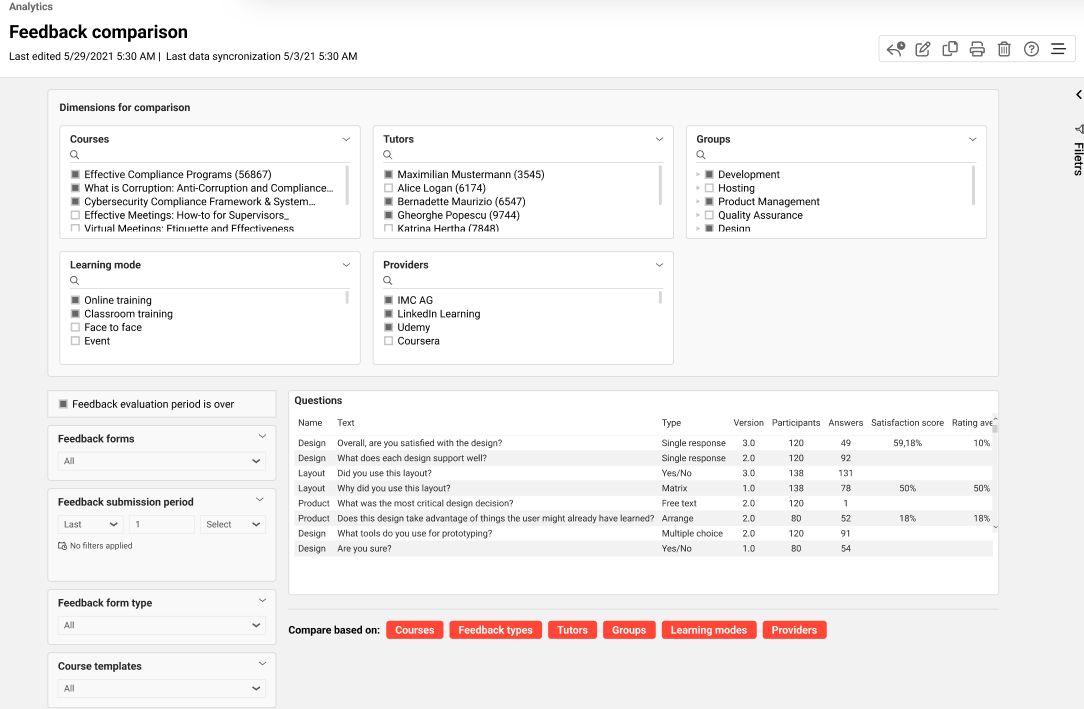
This report enables the report executor to compare the feedback responses across various dimensions so that he can drill down to know the reasoning behind the bad performance of some courses.
Key Performance Indicators
The feedback comparison report analyses the following KPIs in the order mentioned.
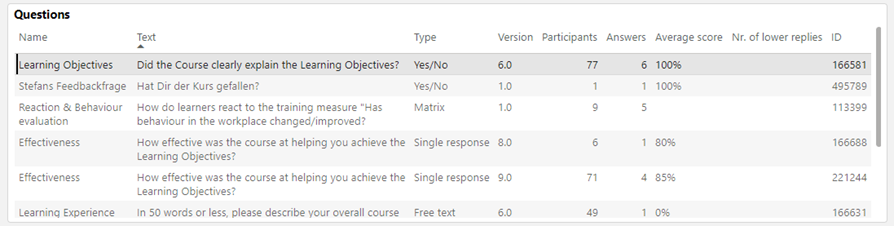
This overview displays the question´s name, text, type, published version, no. of participants of the courses which have the feedback forms to which these questions have been assigned (enrolled, in progress, passed, failed, cancelled (only if they have submitted the feedback)), no. of replies, average score, nr. of lower replies and question ID.
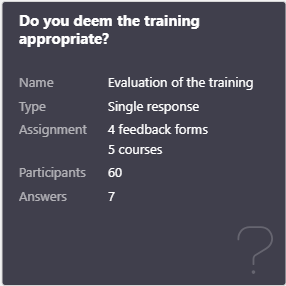
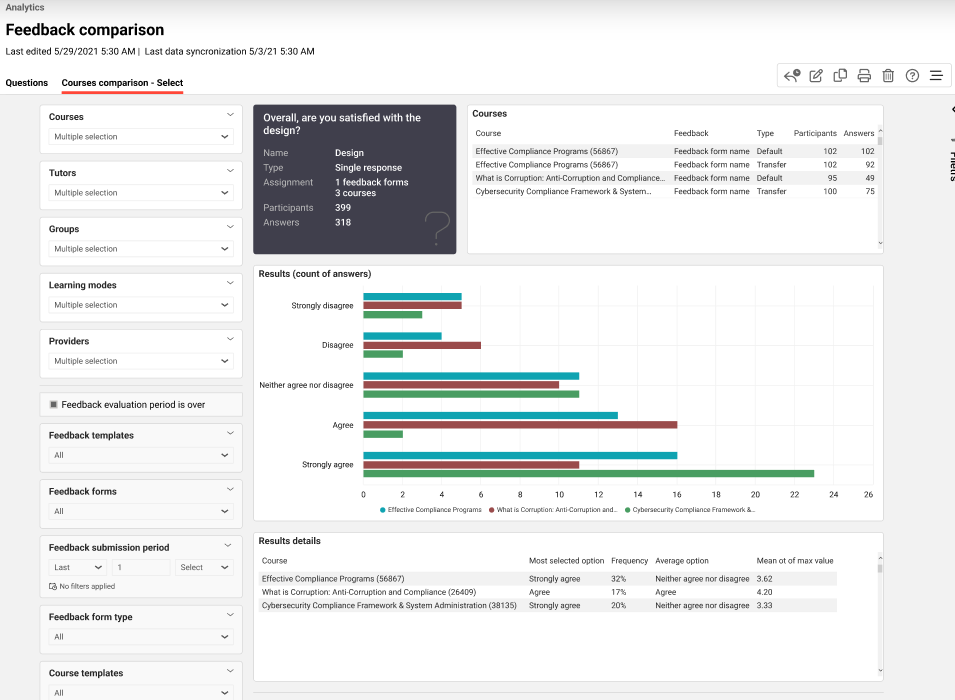
This card is shown if the specific question is selected. It displays question text, name, type, minimum value, maximum value, no. of feedback forms, courses, participants to which have this question has been assigned, no. of replies.
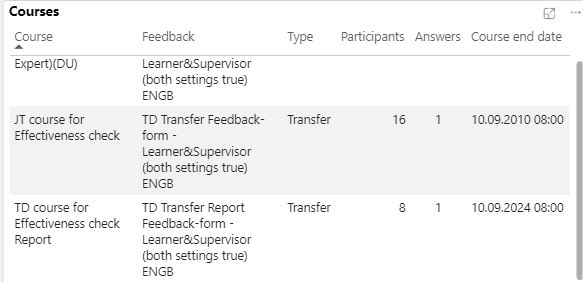
This overview displays courses to which the selected feedback question has been assigned, feedback form name, feedback form type, no. of participants including cancelled participants if they have submitted the responses, no. of replies and course end date.
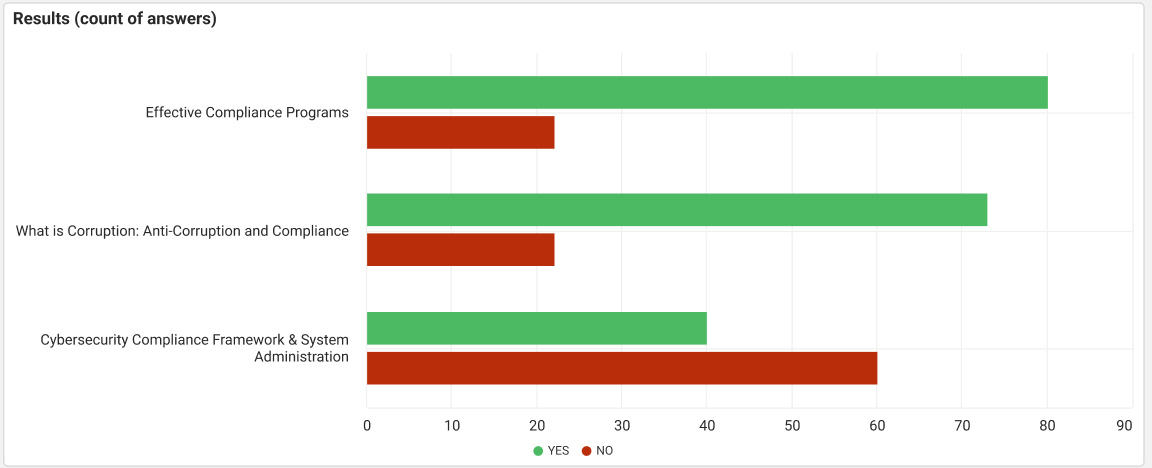
This KPI displays how many participants have chosen yes and how many have chosen no for the selected Yes/No feedback question and compare it across the chosen dimension.
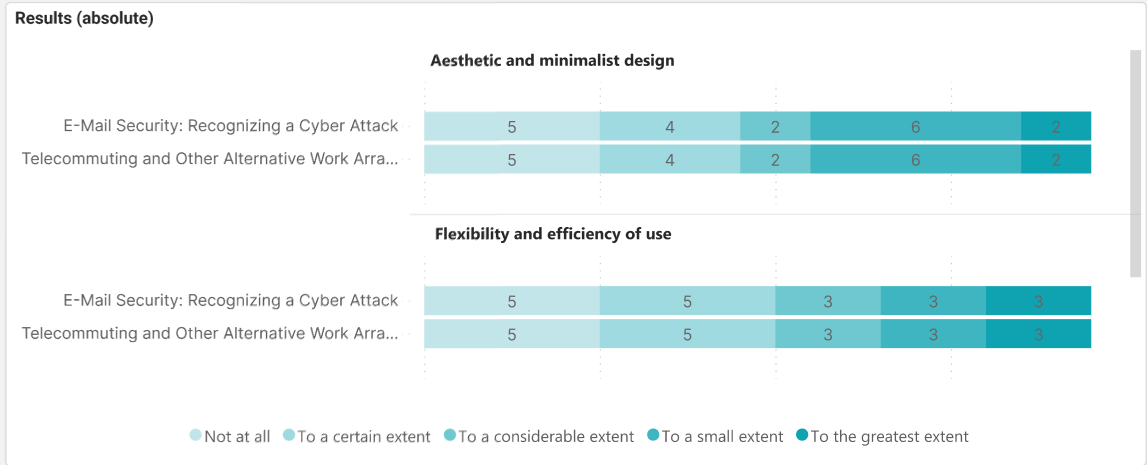
This KPI displays the number of participants who have chosen the respective option in each row of the selected matrix feedback question and compare it across the chosen dimension.
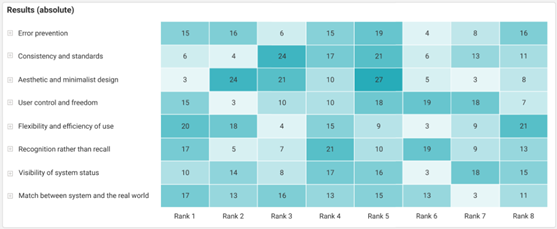
This KPI displays the number of participants who have ranked the specific item as first, second and so on for the selected arrange feedback question and compare it across the chosen dimension.
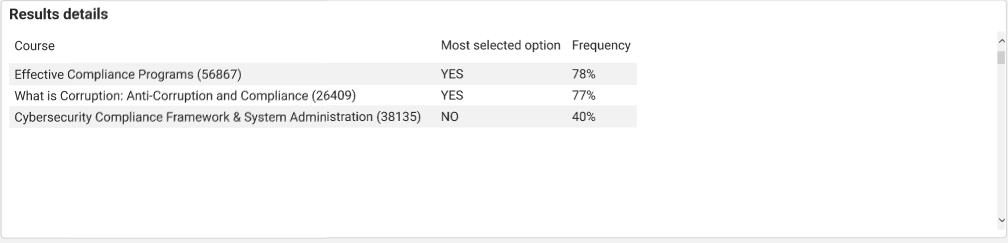
This KPI displays the most selected option for the selected Yes/No feedback question and compares it across the chosen dimension.
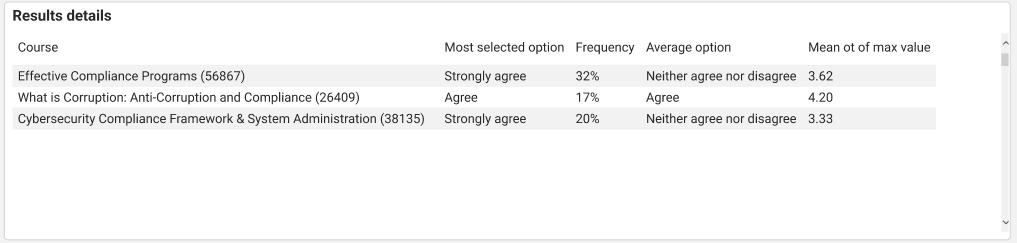
This KPI displays the most selected and the highest averaged option for the selected single response/ multiple-choice feedback question and compares it across the chosen dimension.
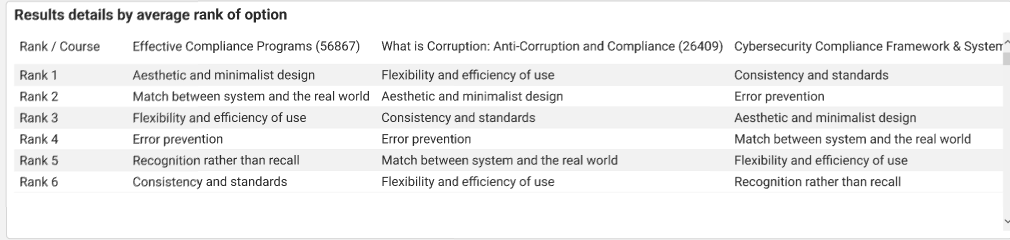
This KPI displays the highest average rank option for the selected arrange question and compare it across the chosen dimension.
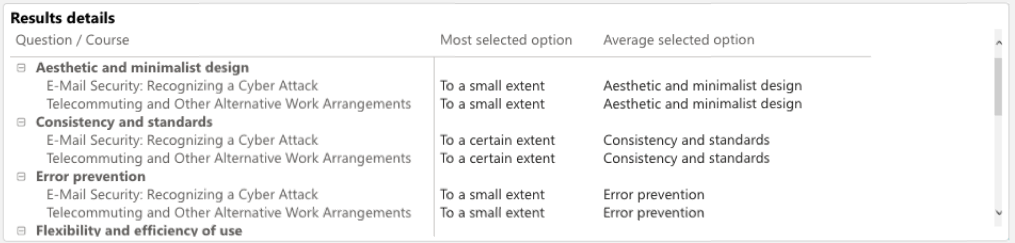
This KPI displays the most selected and the highest averaged option for the selected matrix feedback question and compares it across the chosen dimension.
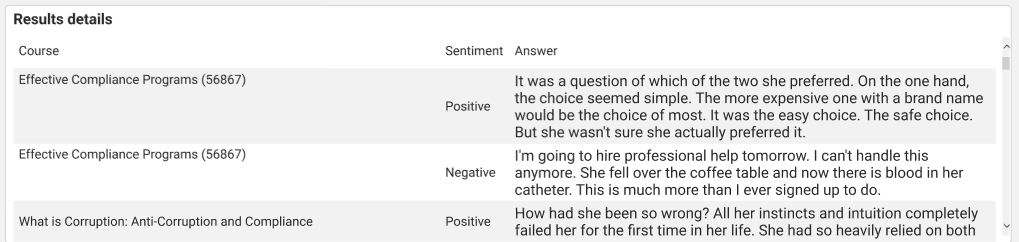
This KPI displays responses for the selected free-text feedback question and marks it as positive, negative, or neutral and compares it across the chosen dimension.
Please note AI functions has been depreciated by Microsoft as of Sep, 2005. The visuals dependent on sentiment analysis would not show data for the time being.
Dimensions
The Feedback comparison report allows filtering the report results by the following dimensions in the listed order.
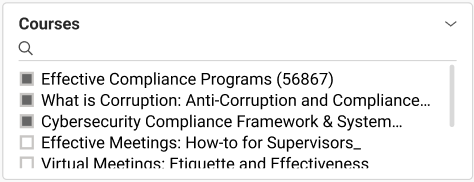
This dimension lists all courses the reporter has access rights.
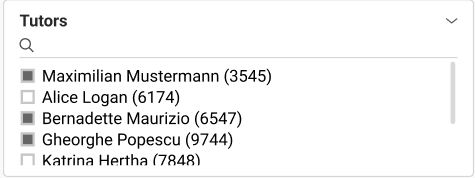
This metric lists all tutors who have been assigned the tutor role in the course template and courses the reporter has access rights.
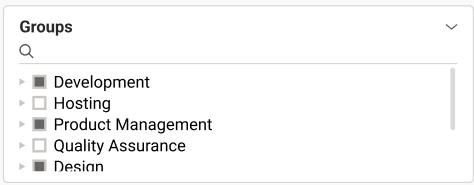
This dimension lists the groups of the learners who are enrolled / progress / failed / passed / cancelled (only if they have submitted the feedback) from the courses the reporter has access rights. The choice of a group tree element selects the subgroups as well.
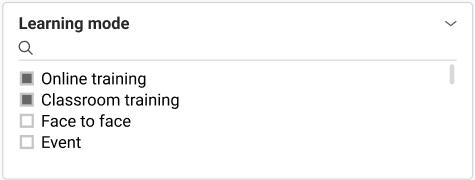
This dimension list all learning modes assigned to the courses the reporter has access rights.
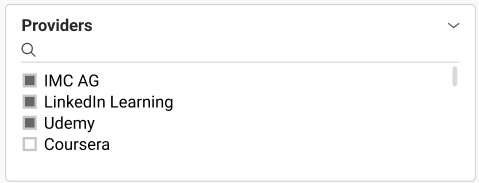
This dimension lists all providers assigned to the courses the reporter has access rights.
Metrics
The Feedback comparison report allows filtering the report results by the following metrics in the listed order.
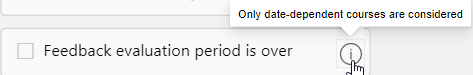
When the “Feedback evaluation period is over” is selected, only the questions from the feedback forms assigned to date-dependent courses for which the feedback evaluation period is over are considered.
N/A is shown in case no such feedback question is available.
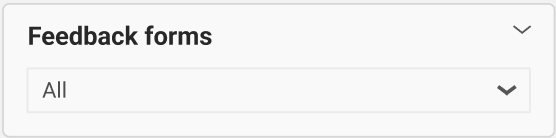
This metric lists all feedback forms assigned to the courses the reporter has access rights. The selection of a feedback form template also selects all listed feedback forms of that template.
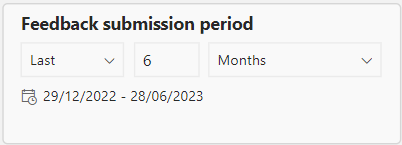
This metric filters the report by the desired feedback submission period when the feedback form was submitted. The default time period is 6 months.
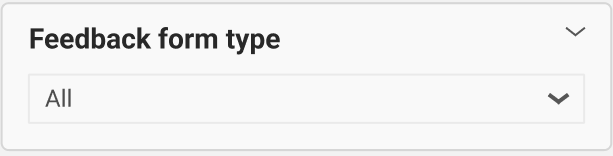
This metric filters the report by the desired feedback form type (default, transfer) of the feedback templates and feedback forms assigned to the courses the user has access to and their course templates.
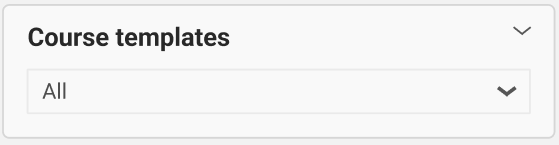
This metric lists all course templates of the courses the reporter has access rights.