
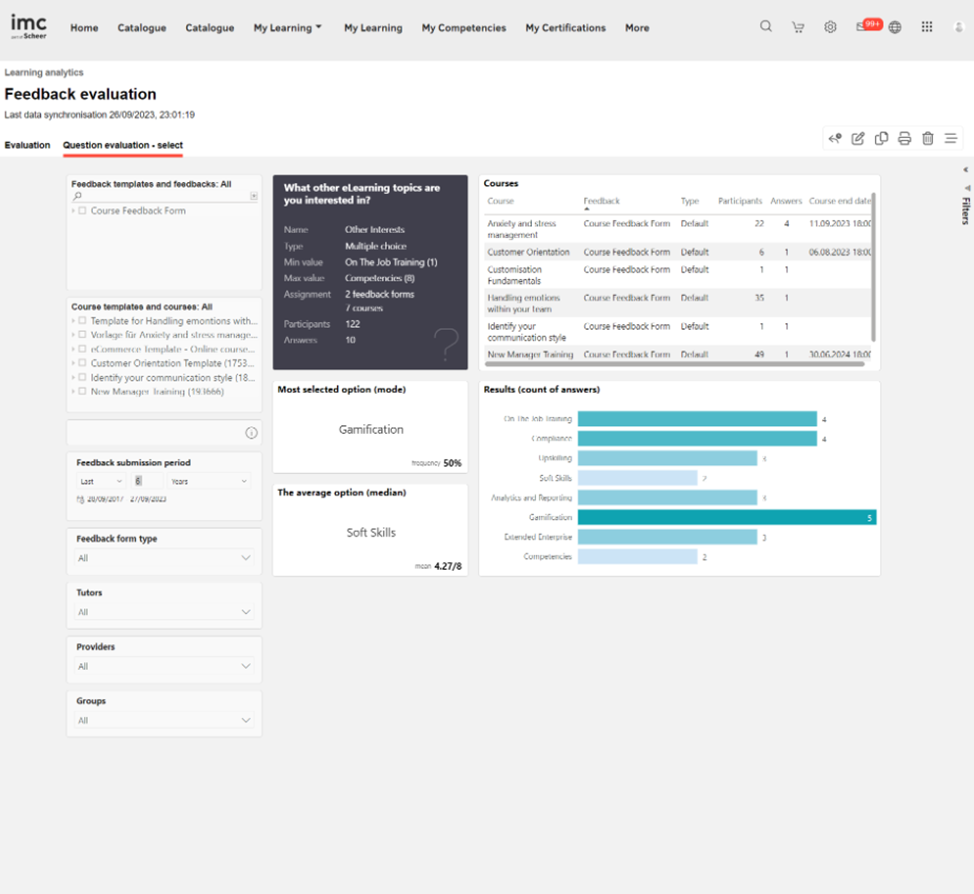
This report provides the report executor with a detailed evaluation of feedback responses, enabling assessment of course performance and identification of relevant actions to increase course efficiency and learner satisfaction.
Key performance indicators
The
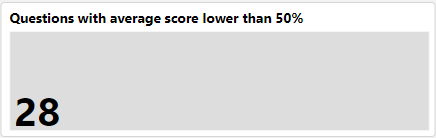
This KPI shows the number of questions with an average score below 50%, reflecting courses that have not been well received by participants and require further improvement. The threshold is configurable. Average Score is calculated as follows:
Yes/No - (no. of users who have responded yes / total no. of replies) * 100
Single response - (average value of the responses/highest value) * 100
Multiple choice - (average value of the responses/highest value) * 100
Free text: (number of participants who responded positively / total number of replies) * 100
For Arrange and Matrix feedback form question types, average score is n/a.
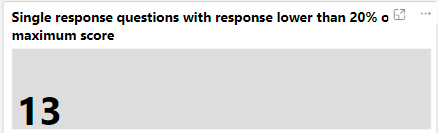
This KPI displays the number of single-response questions that have received at least one response at or below 20% of the maximum value, thereby helping to identify outliers.
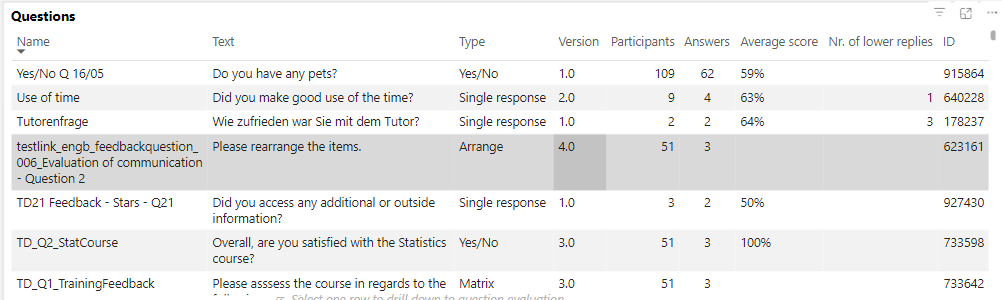
This overview displays the question name, text, type, published version, number of participants in courses with assigned feedback forms (enrolled, in progress, passed, failed, or cancelled only if feedback was submitted), number of replies, average score, number of lower scores, and question ID.
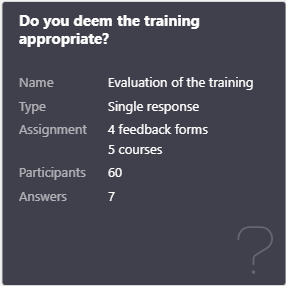
This card is shown when a specific question is selected. It displays the question text, name, type, minimum value, maximum value, number of feedback forms, courses, and participants to which the question has been assigned, and the number of replies.
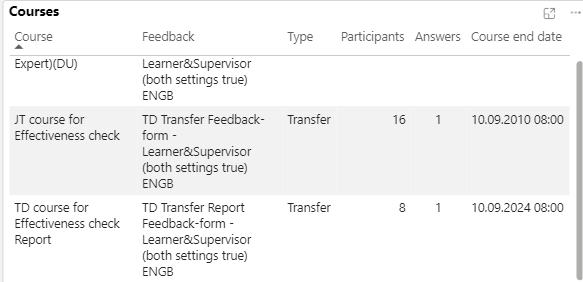
This overview displays the courses to which the selected feedback question has been assigned, the feedback form name and type, the number of participants including cancelled participants who submitted responses, the number of replies, and the course end date.
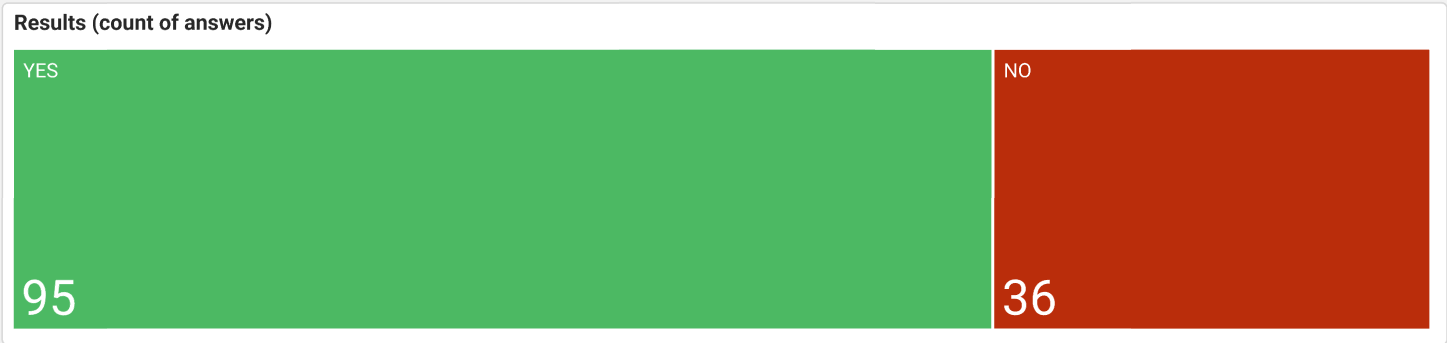
This KPI displays the number of participants who selected yes and the number who selected no.
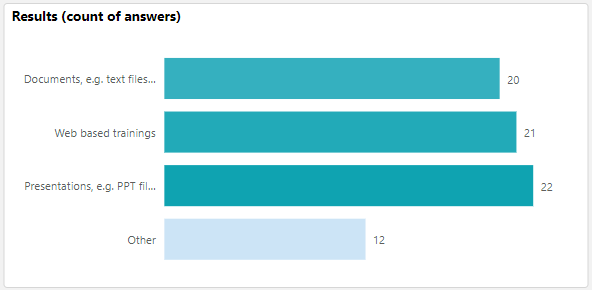
This KPI displays the number of participants who selected the specific option for the selected single-response or multiple-choice question, including both statistically evaluable and non-evaluable responses.
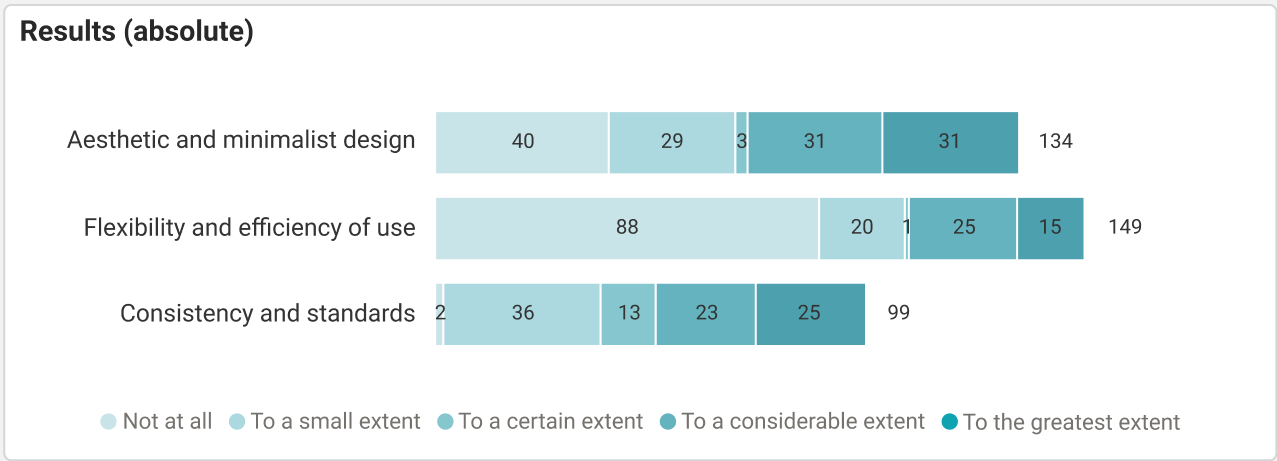
This KPI displays the number of participants who selected the respective option in each row of the selected matrix feedback question.
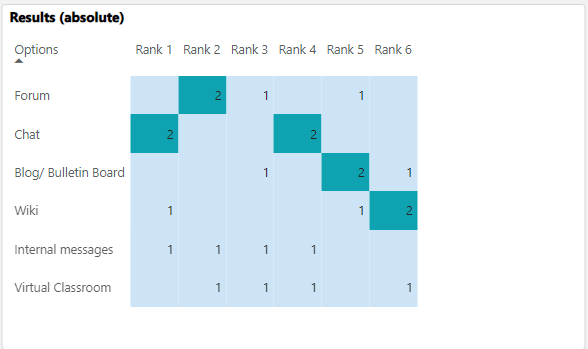
This KPI lists the number of participants who ranked the specific item first, second, and so on for the selected arrange feedback question.
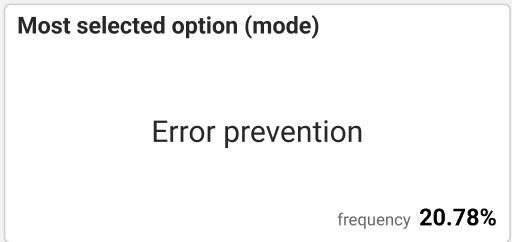
This KPI displays the option selected by the most participants for the selected single-response, multiple-choice, or arrange feedback form question.
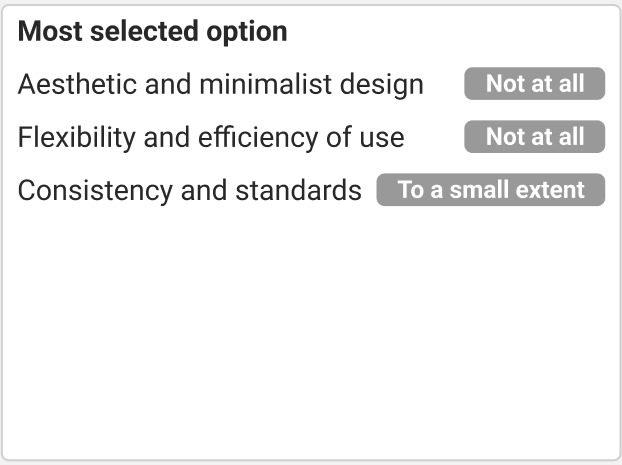
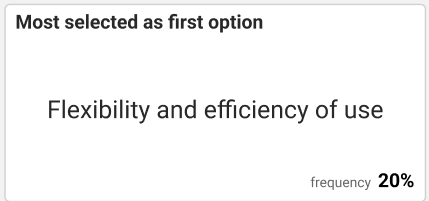
This KPI displays the option chosen by the most participants for each row of the selected matrix feedback question.
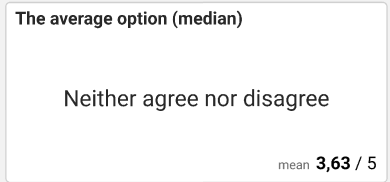
This KPI displays the average option for the selected single-response or multiple-choice feedback form question. For a non-evaluable single-response or multiple-choice feedback form question, this KPI displays N/A.
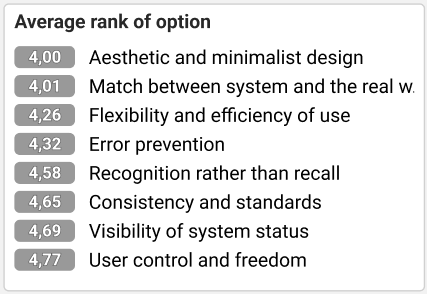
This KPI displays the average rank of each item for the selected arrange feedback question.
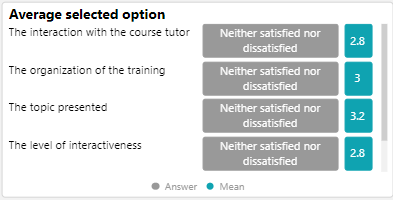
This KPI displays the average option for each row of the selected matrix feedback form question.
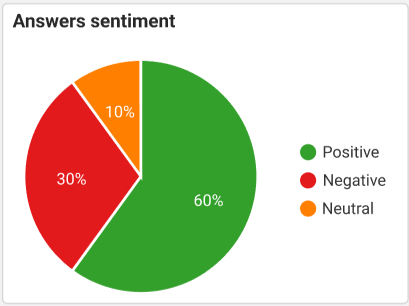
This KPI displays the percentage of participants who responded positively, negatively, or neutrally to the selected free-text feedback question.
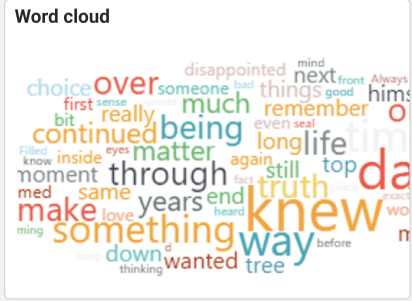
This KPI displays the words used most frequently in responses to the selected free-text feedback question.
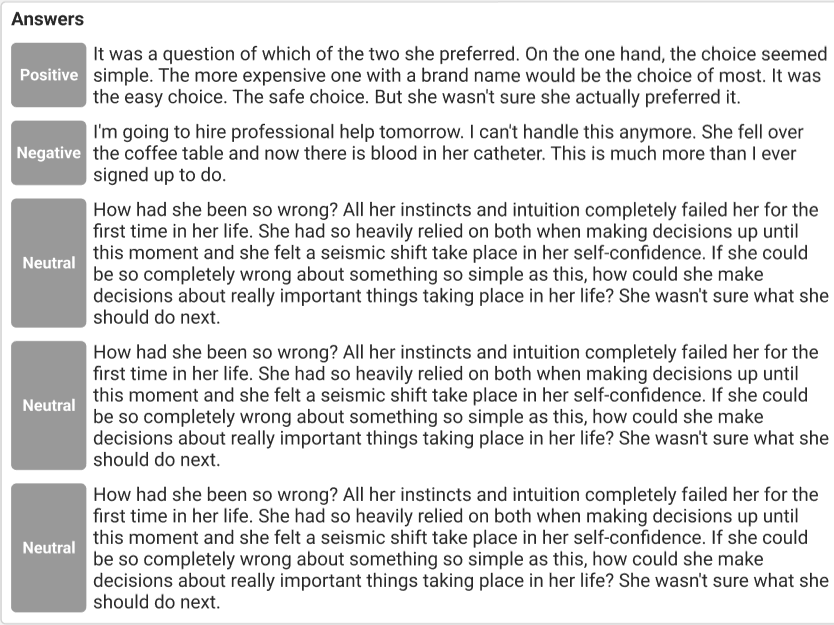
This KPI displays each participant’s response to the selected free-text feedback question and marks it as positive, negative, or neutral.
Please note AI functions has been depreciated by Microsoft as of Sep, 2005. The visuals dependent on sentiment analysis would not show data for the time being.
Metrics
The Feedback evaluation report allows report results to be filtered by the following metrics in the listed order.
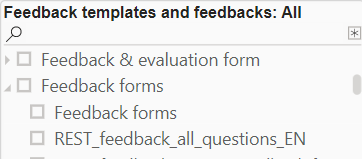
This metric lists all feedback form templates and feedback forms assigned to courses accessible to the reporter. Selecting a feedback form template also selects all listed feedback forms of that template.
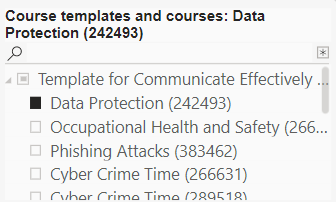
This metric lists the courses accessible to the reporter and their course templates. Selecting a course template also selects all listed courses of that template.

When the “Feedback evaluation period is over” is selected, only questions from feedback forms assigned to date-dependent courses for which the feedback evaluation period is over are considered.
N/A is shown when no such feedback question is available.
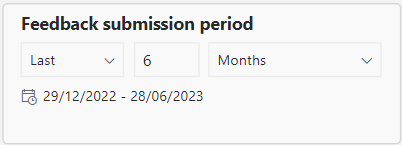
This metric filters the report by the desired feedback submission period during which the feedback form was submitted. The default time period is six months.
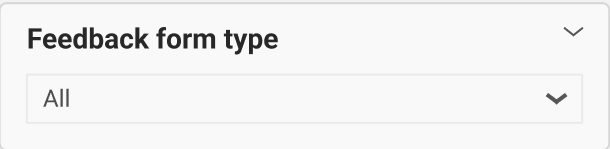
This metric filters the report by the desired feedback form type (default or transfer) of feedback templates and feedback forms assigned to courses accessible to the reporter and their course templates.
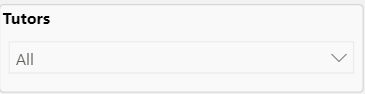
This metric lists all tutors assigned the tutor role in course templates and courses accessible to the reporter.
This metric lists all providers assigned to courses accessible to the reporter.
This metric lists the groups of learners who are enrolled, in progress, failed, passed, or cancelled (only if feedback has been submitted) in courses accessible to the reporter. Selecting a group tree element also selects its subgroups.