The “Course analysis report” evaluates how the courses are running and which ones need immediate attention.
Key Performance Indicators
The Course analysis report analyses the following KPIs in the order mentioned.

Failing rate greater than 20%.
This KPI shows which courses need special focus because of a high fail rate.
Not started rate greater than 20%.
This KPI shows which courses have pending learners who should have started learning so that the reporter can take necessary actions to motivate learners to start.
Cancellation rate greater than 20%.
This KPI shows which courses need improvement because of a high cancellation rate.
Completion rate greater than 80%.
This KPI shows which best practice courses because of their superior performance.
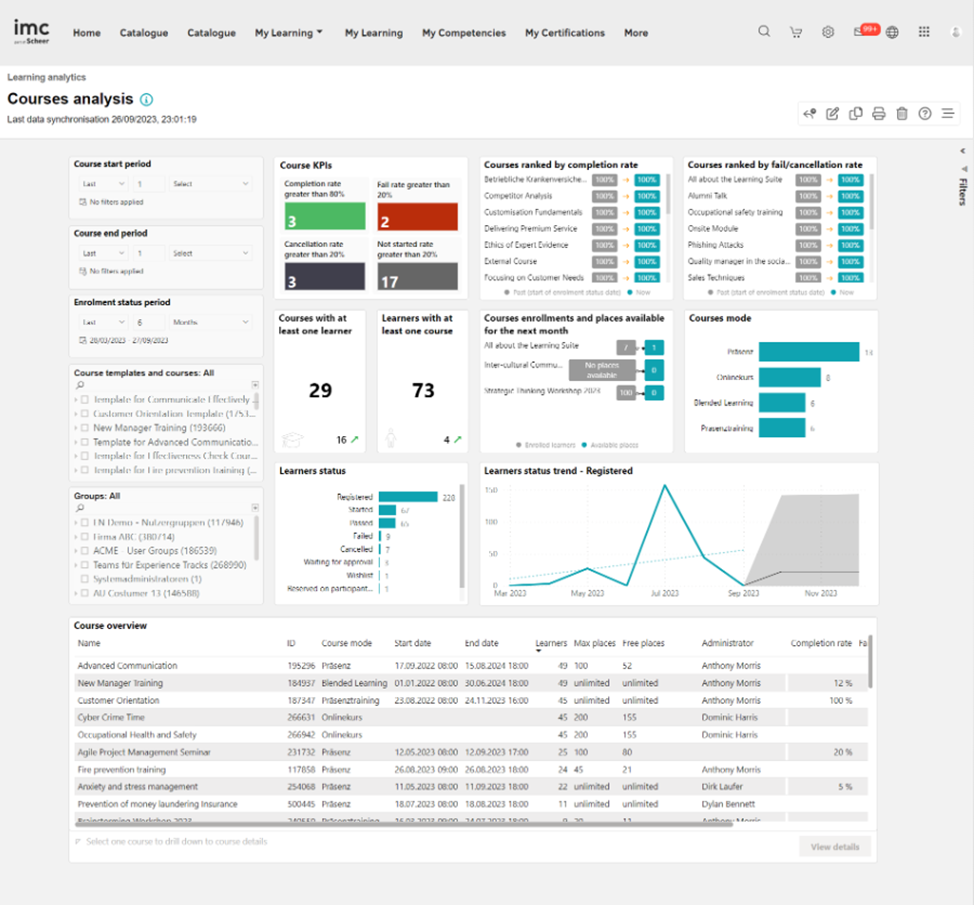
This KPI lists the top five courses in the decreasing order of their completion rate. This KPI also shows how the completion rate has changed from the start of the "Enrolment status period" chosen by the reporter. The arrow shows "the trend" based on whether the up-to-date status is higher or lower than the status at the beginning of the filtered "Enrolment status period".
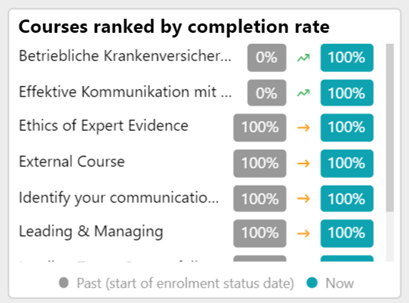
This KPI lists the top 5 courses in the decreasing order of their flop rate which is a sum of failed and cancelled rate. This KPI also shows how the flop rate has changed from the start of the "Enrolment status period" chosen by the reporter.
The arrow indicates "the trend" based on whether the up-to-date status is higher or lower than the status at the beginning of the filtered "Enrolment status period".
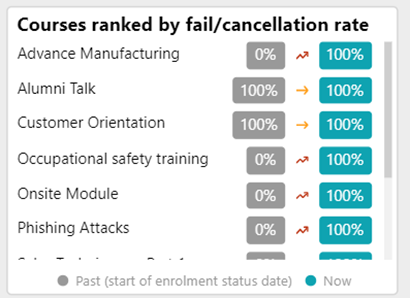
This KPI shows the number of courses with at least one learner who is enrolled, in progress, finished, passed, failed, or cancelled.
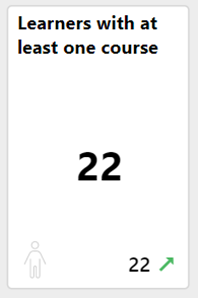
This KPI shows the number of learners with status (enrolled, in progress, finished, passed, failed, or cancelled) on at least one course. It also shows how many learners have increased/decreased from the start of the enrolment status period on the courses.
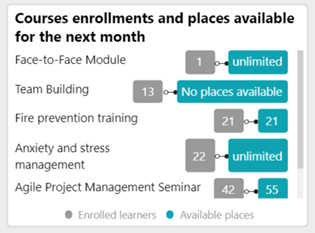
The date-dependent courses which are starting in the next month and have still places available.
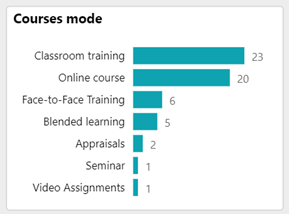
The number of learners on each learning form of the courses (Online course, Classroom training, etc.) can be seen on this KPI.
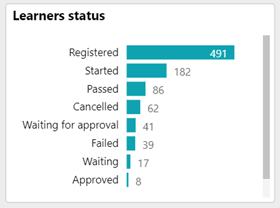
The count of the learners with the respective enrolment statuses on the courses the reporter handles is shown on this KPI.
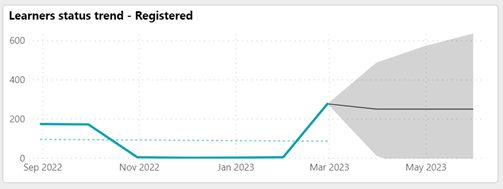
The numbers of users on the status chosen by the reporter on the visual "Learner's status trend" is displayed on this KPI. The period to be considered is defined by the metric "Enrolment status period".
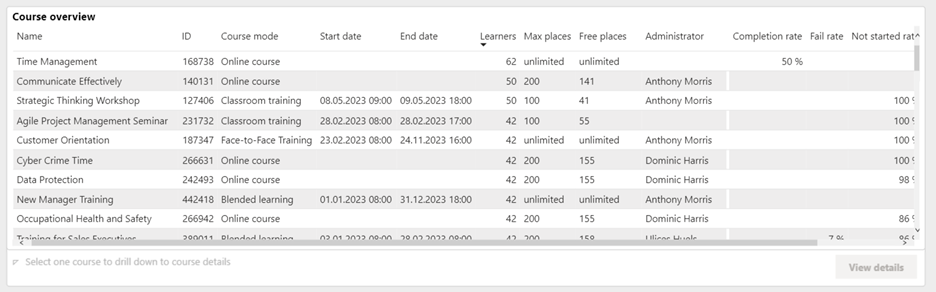
This “Course overview” shows course name, component ID, learning mode, start date, end date, no. of learners, maximum places, No. of free places, Administrator full name, administrator email-address, completion rate, fail rate, not started rate, cancellation rate.
Metrics
The following Metrics are present on the Courses analysis report in the order mentioned.
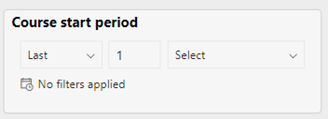
This metric filters the report by courses which have a start date in the chosen period.
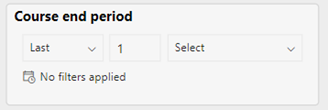
This metric filters the report by course which have an end date in the chosen period.
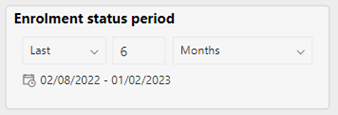
This metric filters the report by the desired period for which the reporter is interested to see the enrolment status changes for the learners. The default is the last six months.
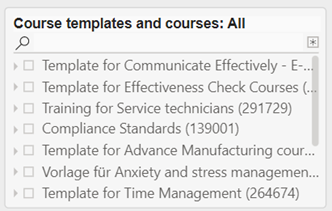
This metric lists the courses the reporter has access rights and their course templates. The choice of a course template also selects all listed courses of that template.
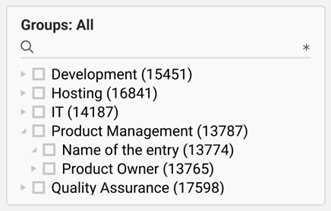
This metric lists all groups containing learners who are related to the courses the reporter has access rights. The selection of a group tree element selects the subgroups as well.